Dashboard, glossary and Map
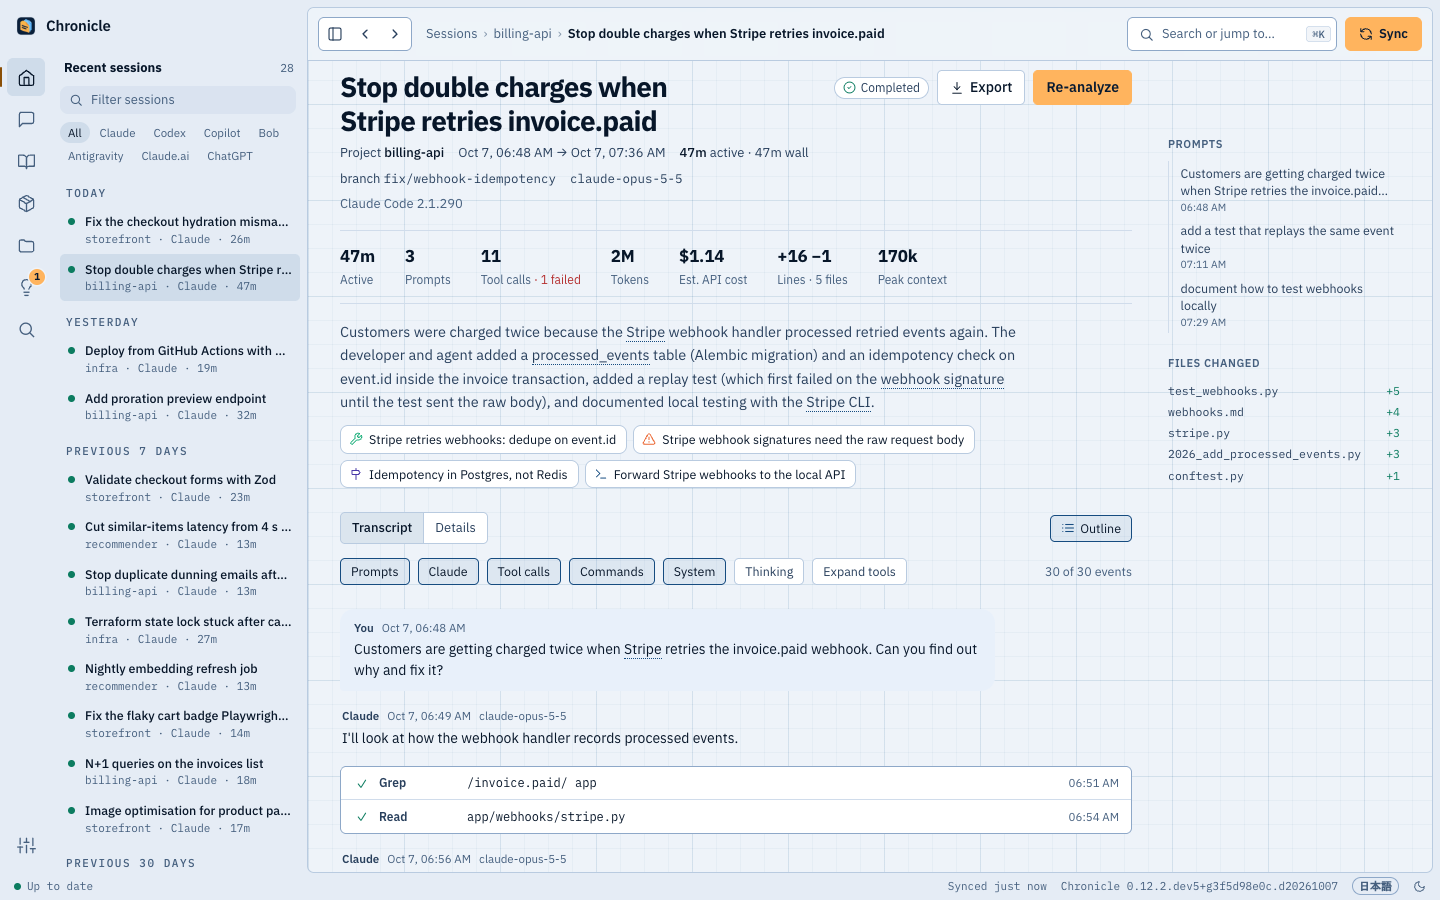
Dashboard: a simplified VS Code layout, drawn in the same blueprint style as interlatch.com:
navy blueprint paper in the dark theme, a whiteprint in the light one, IBM Plex type. An icon rail on the left switches between
Home, Sessions, Knowledge, Projects, Suggestions and Settings (point at an icon, or tab to it, for its name and what
it holds), and the sidebar beside it lists that section:
recent sessions grouped by the day they were last active, with agent filters, knowledge kinds with counts plus Glossary, Map, Global playbook
and Weekly reviews, projects, suggestions by status plus What goes wrong, or Status, Sources, MCP, Devices, Storage and Appearance. ⌘K (also ⌘P or /) opens a palette that jumps
to any session, knowledge item, project, glossary term or page and runs commands (sync, rebuild the glossary, group
themes, switch theme); ⌘B hides the sidebar. The status bar shows background work, the analysis queue, the
last sync and, once one is found, an available update (Updating).
Settings › Appearance picks the theme, the language and whether the dashboard animates (System follows macOS Reduce motion). The fonts ship with Interlatch, so the dashboard never
calls out to a font service. Settings › Devices shows whether this computer is a hub or sends to
one (then also the hub's projects it is in, to join, leave or rejoin), and how to open the dashboard on your phone. Settings › Storage
sets up a copy of your archive in Postgres (A copy in Postgres). On a phone the rail becomes a tab bar at the bottom, the page takes
the whole width, and the dashboard can be added to the Home Screen like an app
(Phone and other computers).
Keyboard shortcuts
| Keys | |
|---|---|
⌘K, ⌘P or / |
Search or jump to any session, knowledge item, project, glossary term or page; run commands |
| ↑ ↓, ↵, Esc | Move through the palette's results, open one, close it |
| ⌘B | Show or hide the sidebar |
| Esc | Close the palette, or the sidebar on a narrow window |
Ctrl replaces ⌘ outside macOS. In the macOS app, drag the window by its toolbar; double-click the toolbar to zoom.
Pages
Knowledge › Learn from your work automatically finds learning interests in your recent questions and requests for explanations: system design, frontend, backend, APIs, data modeling and other engineering areas. Picked up from your questions shows these interests; Why these topics? links to the actual questions. Repeated questions across sessions and recent curiosity give matching lessons priority. Project and topic filters let you focus. Implementation requests alone don't establish curiosity, and teammates' sessions don't shape your profile. Signals use your own last 90 days (up to 200 sessions); new analyses extract them semantically, while older sessions use question matching. Curiosity quotes stay in the local archive and aren't added to shared analysis data. A hub receiving only knowledge may have no personal interest signals; its lessons remain available to browse.
The default Lesson library lists every lesson in each category, with counts and previews. Nothing is capped: read lessons and saved notes stay listed. Your interests put relevant categories first without hiding the others. A lesson can sit in several categories; the library's total counts it once. Project and topic filters and a search help with larger archives.
The Knowledge page opens with a band from the library, each part shown only when it has something: the latest lesson with a principle (else the latest case file), a case file you haven't answered to answer right there (one with ruled-out leads to choose from first, as in All knowledge, and only while Ask first is on), the topic you ask about most (else the one with the most lessons in the last 30 days, never Other) with its two newest lessons, and how many lessons are ready to revisit in this browser.
A lesson reads top to bottom, each part once, with nothing to type or reveal. A case file starts with the scene, the question and its answer. Then come the explanation, the leads the session ruled out, The principle to keep (the idea that carries over to other work) and Use it in your next task (checks for similar work). A diagram appears only when the analysis drew one from the session: its parts carry the session's own names, and each says its role. The principle, checks and diagram come from analyses made with this version; a lesson analyzed earlier shows its title and explanation until its session is analyzed again, and nothing is made up to fill the gap. Explore related ideas, Look at the evidence and the source session are a click away.
Save work note saves a prepared explanation with any recorded principle and checklist immediately. Saved work notes displays these notes ready to read or copy; Edit work note opens an optional, prefilled editor. Nothing is written to project files or agent instructions. Reading history and notes stay in this browser, separated by signed-in viewer; they are never sent to the hub. Mark as read adds a read badge, while Next lesson continues through the category's full list. Revisit sooner adds a revisit badge in three days; other read lessons get that badge in seven days. Both remain available to open at any time. Reading isn't scored as mastery or recall. There is no overdue counter or required backlog. Changed lesson material receives a new badge. Hypotheses and work in progress are excluded.
Pages: Home (active-time headline with active days and longest run; stat tiles with sparklines and a per-day rate until a full prior period exists to compare against; daily chart with a 7-day average; outcome breakdown; activity calendar with streaks; busiest hour; projects, tools with failed calls, models and agents), a sortable, filterable session list, project cards with 12 weeks of activity (in your own groups), the Systems map, session pages (headline figures, the summary and the knowledge it produced up top, then Details, where a session opens: goal, highlights, open threads, the knowledge items, context-window chart with compactions, tools, files, subagents, and the artifacts the session made; or Transcript, where a search result opens: the conversation with one-line tool calls that expand to their input and output, and subagent threads; on wide windows an Outline of the prompts, what the session made and the changed files sits beside the transcript and follows your scroll), a Knowledge overview (a Learn from your work band, then one card each for the Map, All knowledge, the Glossary and Weekly reviews, with a glance at what is inside), knowledge browser (pin/dismiss; each item shows its stage, and the table sorts by it; fixes, gotchas and decisions read as case files that ask before they tell), project knowledge bases and the global playbook (a TL;DR, section chips, a filter, and sections as cards of short bullets that open to their detail and sources, with established and canonical bullets marked; a project's opens with its architecture sketch), glossary, a mindmap of the glossary (see Map below), weekly reviews (one week at a time: a three-line TL;DR, the week's numbers against the week before, active time per day, where the time went, outcomes and knowledge captured, then themes and short lists of what shipped, what was learned, what is still open, what slowed you down, what to try next and which trusted knowledge was overturned; the full write-up is folded away), Search all sessions (the magnifier in the rail, or the last entry when you type in ⌘K): every session that mentions a word or phrase, most mentions first (or newest/oldest), each with its mentions highlighted in transcript order; Show all lists every one, and clicking a mention opens the transcript there with the terms still marked. Glossary terms are underlined wherever they appear (transcripts, knowledge, summaries): hover for the definition, click for the entry. Every chart has a table view; light and dark themes.
Project groups
Put related projects under one heading, such as Aktio for every Aktio repository, on the Projects page and in its sidebar. Groups are one level deep, and only change how projects are listed: each project keeps its own sessions, knowledge base and hub sharing.
- Make one: New group on the Projects page, or New group… in a project's group menu (the folder button on
its card, or at the end of its row in the list). Tick the projects that belong. Interlatch offers a folder rule for
the folder they share (one per computer, so
~/Projects/Work/AI-BPO/Aktioandaktio-vm:/root/Aktioboth), and names the group after it. Remove the rule or add your own before you save. - Folder rules: a project anywhere under a rule's folder joins the group, including ones you start later. When two groups' rules both cover a project, the longer (more specific) folder wins.
- By hand: a project's group menu moves it to another group, or to No group. A move by hand wins over the folder rules; moving it back where its folder puts it lets the rules decide again. Chats (claude.ai, ChatGPT) have no folder, so they join by hand.
- Edit on a group's heading renames it, changes its rules and projects, or deletes it. Deleting a group keeps its projects; they go back to what the other groups' rules say.
- Each group folds away, on the page and in the sidebar, and stays folded in that browser. On Sessions, the project filter lists projects under their groups, with All of group to see every session in a group. A project's page shows its group in the breadcrumb.
Groups are kept in this computer's archive and never go to a hub. On a hub with people, admins see and change the hub's groups; someone limited to some projects sees none. On a computer that sends to a hub, a whole group can be shared there as one project: see A group as one project on the hub.
Suggestions and What goes wrong
Suggestions (the lightbulb in the rail; its badge counts suggestions you haven't seen yet) is the queue of fixes
Interlatch proposes: lines for your CLAUDE.md or AGENTS.md, a change to the Playwright MCP server in
~/.claude.json, and setup steps for you to run. A status switch moves between To review, Applied, Done,
Stale and Dismissed, and a menu narrows to user-level suggestions or one project. Cards are grouped by the
file they change; each shows its evidence ("seen in 31 sessions across 17 projects · still happening · last
2026-10-01"), example sessions, warnings (public repository, looks sensitive, file not tracked by git) and the line,
which you can edit. Preview shows the diff, Apply writes it (the file is backed up first), Dismiss drops
it for good, and an applied card has Undo. Move to every project puts a project's line in your user-level file
instead, and a user-level card can move back to its projects (Moving a line). Setup steps show their command with Copy and Mark done;
Interlatch never runs them. Check again looks at the latest sessions now. When something is waiting, Home
shows the top 3 with Approve and Dismiss.
What goes wrong lists the failures that keep coming back across your sessions, for 30, 90 or 180 days or all time and any project: sessions and projects hit, a 12-week trend, last seen and whether it is still happening, and a link to its suggestions. Click a cause for examples and fixes. Below are the tools that fail most, and a Noise card for expected failures (tests failing in a dev loop, provider outages), collapsed. See Suggestions and What goes wrong.
Artifacts
Artifacts (the box in the rail) lists what your agents made: documents, HTML pages, diagrams, decks, spreadsheets, generated images, published links (claude.ai artifacts, Claude docs, Google Drive files, Slack canvases), pull requests and commits. Each comes from an explicit signal in a transcript, never from scanning your disk:
- a file the agent created or wrote whole (an edit to an existing file is not an artifact), when it is a deliverable:
Markdown, HTML, SVG and other diagram formats, office files, PDFs, CSVs and images. Code, agent config and memory
(
CLAUDE.md,AGENTS.md,~/.claude), dependencies and build output are left out, and so are an app's own pages, icons and templates inside its source folders; - a deck, document, spreadsheet or PDF a script saved (python-pptx, a converter): a path the session's commands or
their output name, whose file was created while the session ran (a file it only read existed before). Files in
~/Libraryand the system's temporary folders are left out; - a page published with Claude Code's Artifact tool, a Claude doc, a Google Drive file or a Slack canvas;
- a pull request from
gh pr createor a GitHub tool, or Claude Code's own PR record; - a commit: git's
[branch sha] subjectline, agit log --onelineafter a quiet commit, or the message of a quiet commit that printed no hash; - an image from Codex's image generator;
- in claude.ai chats, its artifacts (every update a version) and the files it handed over (
present_files).
The same file, link or commit is one item across sessions, with its versions and how many sessions made it. Each row
says where it stands: on disk as the agent wrote it, changed since, gone (the session's transcript still
holds what was written), in the chat for claude.ai, or a link. Filter by kind, project or words, hide what is
gone, or open the session at the tool call that made it. Open (or a click on the title) shows the file in a new tab:
as it is on disk, or, once it is gone, as the agent wrote it, rebuilt from the archived transcript (for files Claude
Code or Codex wrote whole). An HTML page keeps its own scripts but runs in a sandbox, with no way into Interlatch's data
or API; Markdown and CSV show as text, PDFs in the browser, and office files download. The ⋯ menu opens a file still on disk in its own
app (Open on this Mac: Keynote or PowerPoint for a deck, your editor for Markdown), shows it in Finder, or copies
its path. Those two appear only in a browser on the computer Interlatch runs on, never through Tailscale from another
device. Images and SVG diagrams still on disk
show a thumbnail, and so, on a Mac, do decks, documents, spreadsheets and PDFs (their first page, drawn by Quick
Look); Images, Diagrams and Decks lay them out as a grid, and a click shows one full size. A file made in a
claude.ai chat stays in claude.ai, since the export leaves it out: claude.ai ↗ opens the chat to download it. Interlatch
serves only files it recorded as artifacts, by their id, and an SVG opened on its own runs in a sandbox, so a script
inside it cannot run. A file that is gone has no preview yet: the transcript records that it was written, not its
pixels. A project page lists its latest
artifacts, and a session's Details lists everything it made. Agents can search them too, with the
find_artifacts MCP tool.
Architecture sketch
When a project's knowledge base is synthesized, the model also draws the project's main parts (code it owns, ways in
such as a CLI, UI, API or MCP server, data it keeps, external services) and how they connect. Every part and
connection must cite the knowledge items that state it: a connection with no valid source is dropped, and so is a
part left with no connection, so the sketch shows only what your sessions established. The project page draws it in a
hand-drawn style (rough.js, shipped with Interlatch). Hover a part for what it is, click a part
or a connection to see the knowledge it comes from, and switch to Table for the connections as a list.
Excalidraw downloads it as an .excalidraw file laid out the same way, to edit in excalidraw.com or the
Excalidraw VS Code extension. The Markdown knowledge base (notes export, project_knowledge over MCP) carries it as a
Mermaid flowchart under Architecture. Knowledge bases synthesized before this show no sketch until their next
synthesis (Re-synthesize on the project page). The global playbook has none.
Systems map
Projects › Systems map (or System map on a project page) draws every folder your agents worked in as a
system, inside boxes for the folders they live in (Work › AI-BPO › Cosmo), with lines for how systems connect. A solid
line means sessions in one project edited or read files of another; a dashed one means the glossary records how one
project uses the other, and its note is the evidence ("its run.sh launches the two workers process_monitor
monitors"). Click a system for its summary (what it is built with, where it runs, what it uses, its links), double-click
or Open system for its parts. Find systems matches names, stacks and where systems run; One-session folders
shows the folders with a single session and no links, hidden by default.
A system's page stacks its parts in five rows: Ways in (UIs, command lines, extensions, MCP servers), Code (APIs, services, packages), Data (databases and files), Delivery (CI, Terraform, container images) and Runs on & uses (deployed apps, servers, clouds, APIs). Nothing is drawn by a model, and everything comes from evidence:
- the project's manifests, read-only:
package.json,pyproject.toml,requirements.txt,Cargo.toml,go.mod, compose files (services, ports,depends_on, andhttp://service:portin a service's environment), Dockerfiles, Terraform resources, GitHub workflows (what they publish to), vite proxies,.env.exampleand deploy configs (firebase.json,wrangler.toml,databricks.yml,host.json, ...). A vite proxy to the port the backend runs on becomes "frontend calls /api backend"; - what sessions ran: servers started on a port (in the folder they
cd'd into), hosts reached (Azure App Service, Databricks Apps, IBM Code Engine, Firebase, GitHub Pages, ...), cloud CLIs (az,ibmcloud,databricks,gcloud, ...), machines reached withssh,scporrsync, and databases opened withpsqlorduckdb. A host only counts when a command went there or two sessions named it, so a test's made-up URL never becomes a deployment, and what ran after acdinto another project belongs to that project; - the files sessions touched, for each part's activity and for links to other projects.
The same thing found twice is one part: the App Service Terraform declares and the host commands reached, or the
PostgreSQL a dependency names and the one compose runs. Click a part for Why it is here: the manifest lines and the
commands behind it, each command linked to its session. Worktrees count as their repository, a folder that only
holds other projects is a group, and a project that also ran on another machine (host:/path) shows it under Also
runs on. interlatch systems prints the same map in the terminal, interlatch systems NAME --evidence one system with
its example commands. To use sessions only, set [systems] read_manifests = false (Configuration).
Glossary
built by the analysis model from each project's distilled knowledge (not the raw transcripts), one call per project plus a cross-project pass, refreshed whenever a project's knowledge base is re-synthesized. Each term has a category, aliases (abbreviations, translations of Japanese business terms), a definition, a per-project usage note, related terms, and full-text statistics: how many sessions mention it, first and last seen, top sessions.
Map
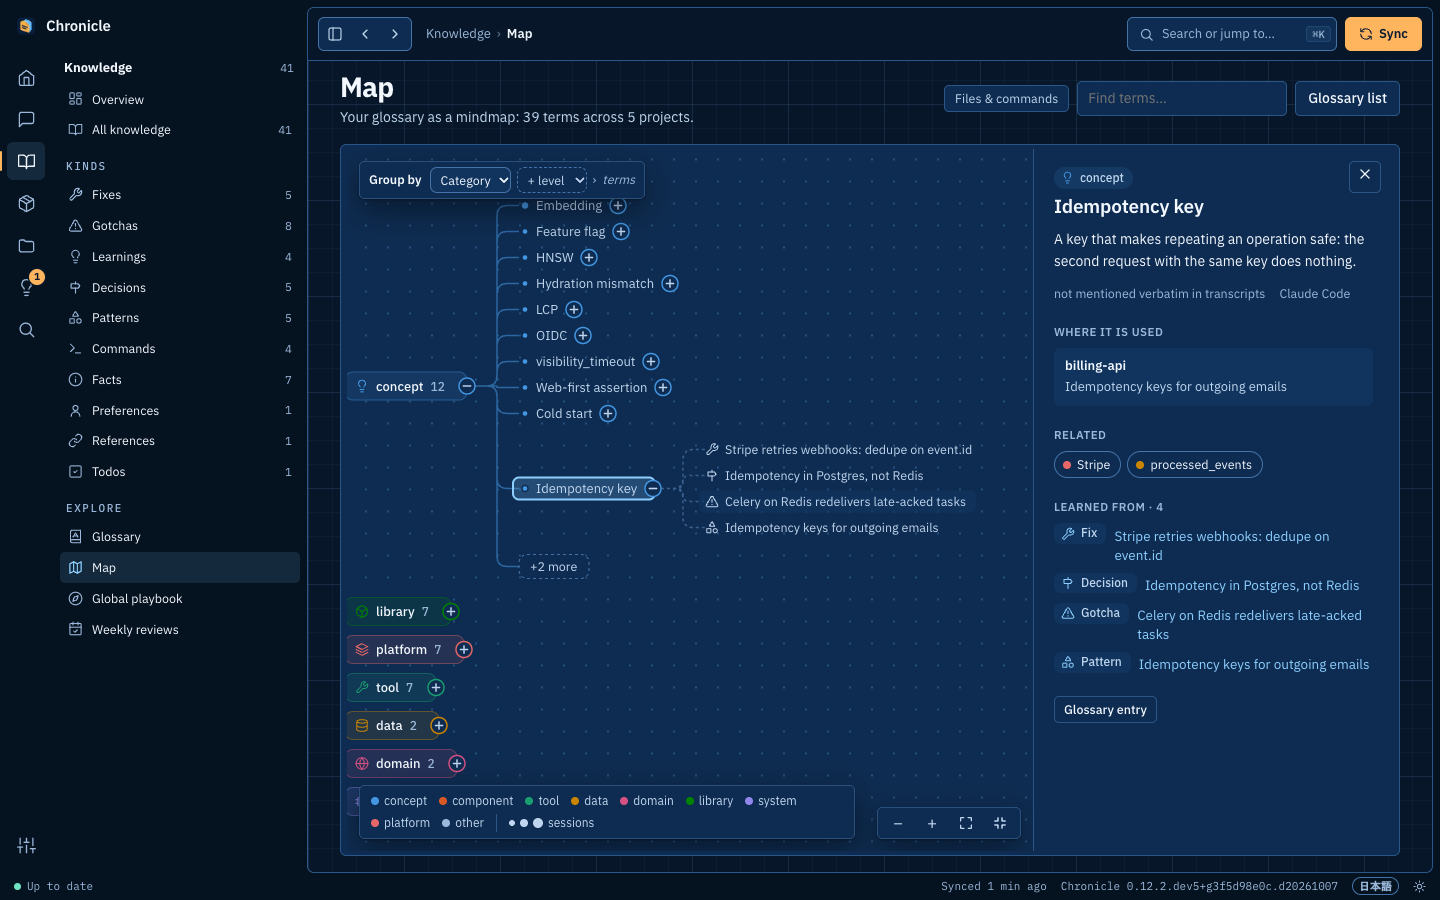
The dashboard's Map page draws the glossary as a collapsible mindmap. Group by (top left of the
map) stacks any of four levels in any order: Category, Theme, Project and Agent (the agents whose
sessions taught the term), with terms last. The side panel's Views offer common stacks (Category › Theme,
Project › Category › Theme, Category › Project, Agent › Category › Theme). Terms open into the knowledge items they
were distilled from and the sessions that mention them most. Click a node to open or close it and see its details:
a term's definition, where each project uses it, related terms (click to jump there), its knowledge and sessions;
a category's themes; a theme's description. Drag or scroll to move, pinch or ⌘-scroll to zoom; the view glides to
keep an opened branch on screen. Find terms (Enter) opens every match at once: terms whose name or alias has
all the words, terms whose definition mentions them, and themes, categories, projects or agents named that way.
Branches along the way show only the path to a match (the rest stay under +N more), matches are highlighted, and
the side panel lists them grouped (Groups, Named, Mentioned in the definition), each a click away; a single match
opens straight to its details. The search stays in the link (q=), so a reload or a change of Group by keeps
it; clear the box or close the panel to leave it. Colour marks the category (the eight largest
have their own hue, the rest share grey; project and agent levels are neutral); a term's dot grows with the number
of sessions that mention it (1, 2–4, 5+). File names and commands are hidden until you turn on Files & commands.
No branch draws more than 10 children (12 at the top; a term shows up to 6 knowledge items and 4 sessions): the
most-discussed come first, and +N more lists the rest in the side panel, filterable as you type, where picking one
adds just that node to the map (related-term links do the same). Every glossary entry links to its place
on the map (on the map →).
Themes
The analysis model splits each glossary category with 25 or more terms into 4–10 named themes (for example concept →
"Cloud infra, auth & integrations", "Agent dev workflow & tooling"), one call per category, so no level of
the map is a long list. Themes are rebuilt after glossary rebuilds, only for categories whose terms changed; terms
added since then show as Not grouped yet. Run it by hand with interlatch glossary --themes [--force] or the
Group into themes button in the map's side panel. On a 1,360-term glossary, the ten big categories cost about
$1.40 API-equivalent in total.